
Visualize and design database schemas using smart queries to generate interactive diagrams and SQL migration scripts.
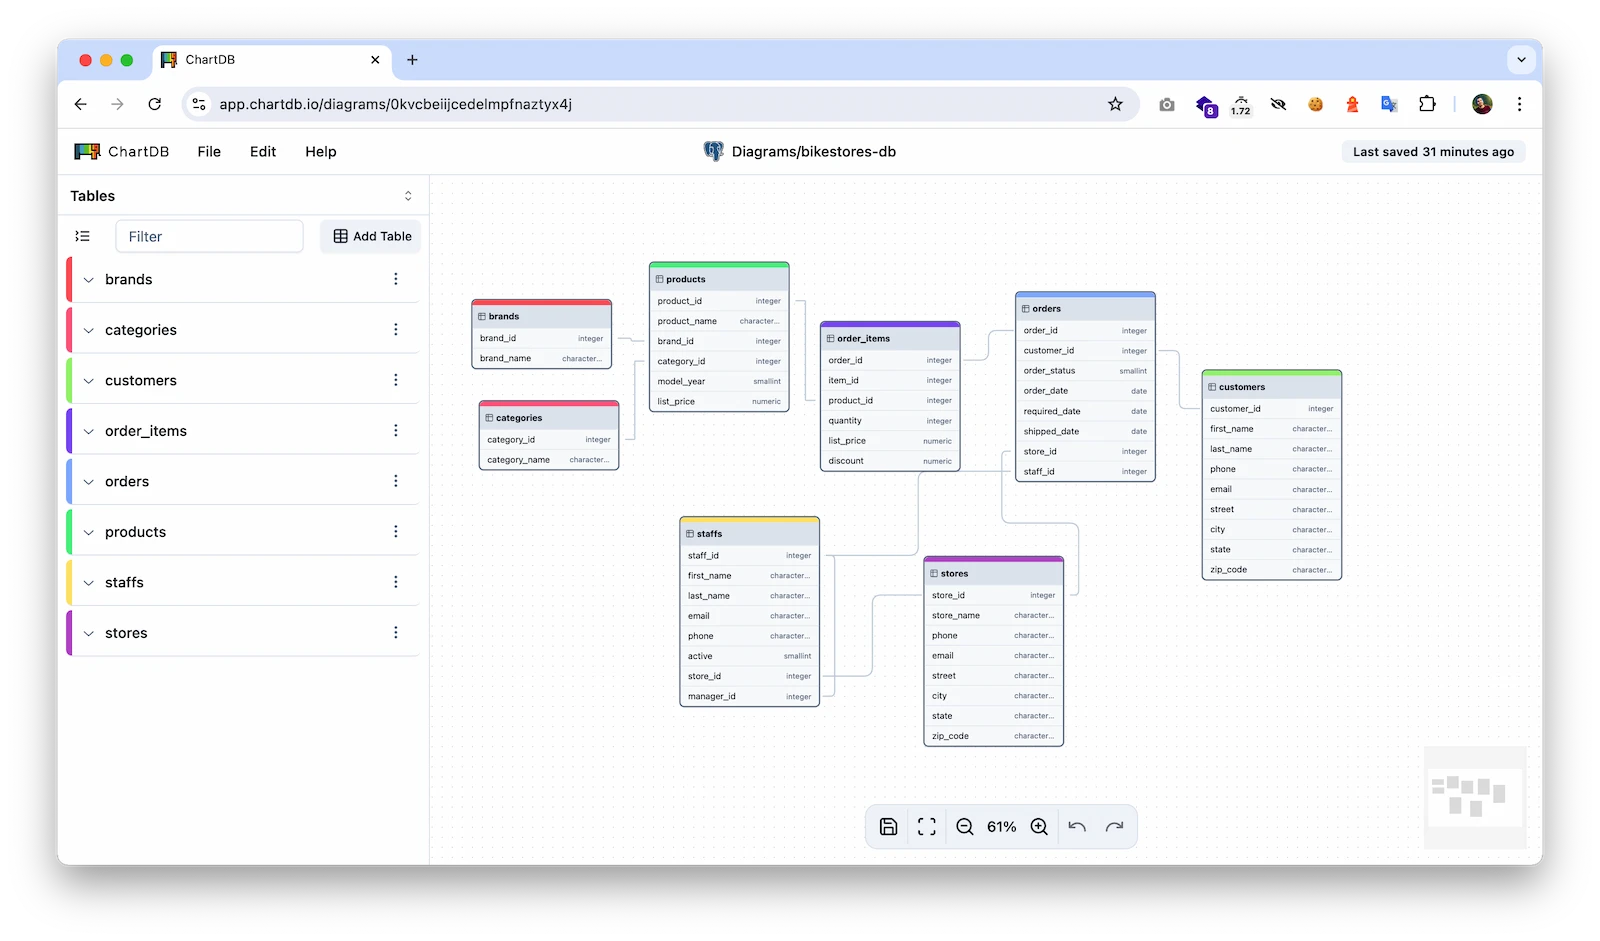
ChartDB is an open-source web application used for visualizing and designing database schemas. It allows users to generate interactive diagrams from their existing databases by using specific queries to retrieve schema information as JSON data. This approach enables the visualization of complex data structures for the purposes of documentation, team discussions, or general schema analysis.
The software is deployed as a server, available via a cloud version or through local installation using npm or Docker. It operates without requiring database passwords, as users manually run a query in their own database environment and paste the resulting JSON into the application. This architecture ensures that the application does not need direct access to the database server to function.
Key features
- Schema import via JSON data retrieved from smart queries
- Interactive editor for adjusting and annotating database structures
- DDL script generation for database migrations
- Support for PostgreSQL, MySQL, and SQL Server
- Support for MariaDB, SQLite, CockroachDB, and ClickHouse
- AI-driven export capabilities for dialect conversion
- Local deployment options via Docker containers
- Privacy controls to disable integrated analytics
The application is built with React and TypeScript, utilizing React Flow and xyflow for the diagramming interface. It supports integration with OpenAI or custom inference servers, such as vLLM, to enable AI-powered migration scripts. These scripts help translate schemas between different database dialects, such as migrating from MySQL to PostgreSQL or SQLite to MariaDB. The tool is designed for developers and database administrators who need to document data structures or plan migrations without granting external software direct access to their database credentials.
ChartDB serves as a technical utility for database schema visualization and DDL script generation.
Similar Open Source Software

drawDB
A browser based database schema editor for creating entity relationship diagrams and generating SQL scripts without accounts.

Chat2DB
A database client and SQL workspace that uses AI to convert natural language into SQL queries.


Join our newsletter to get shiny new open source software delivered to your inbox. Unsubscribe anytime.