
An observability platform that unifies logs, traces, metrics, and session replays on top of ClickHouse clusters.
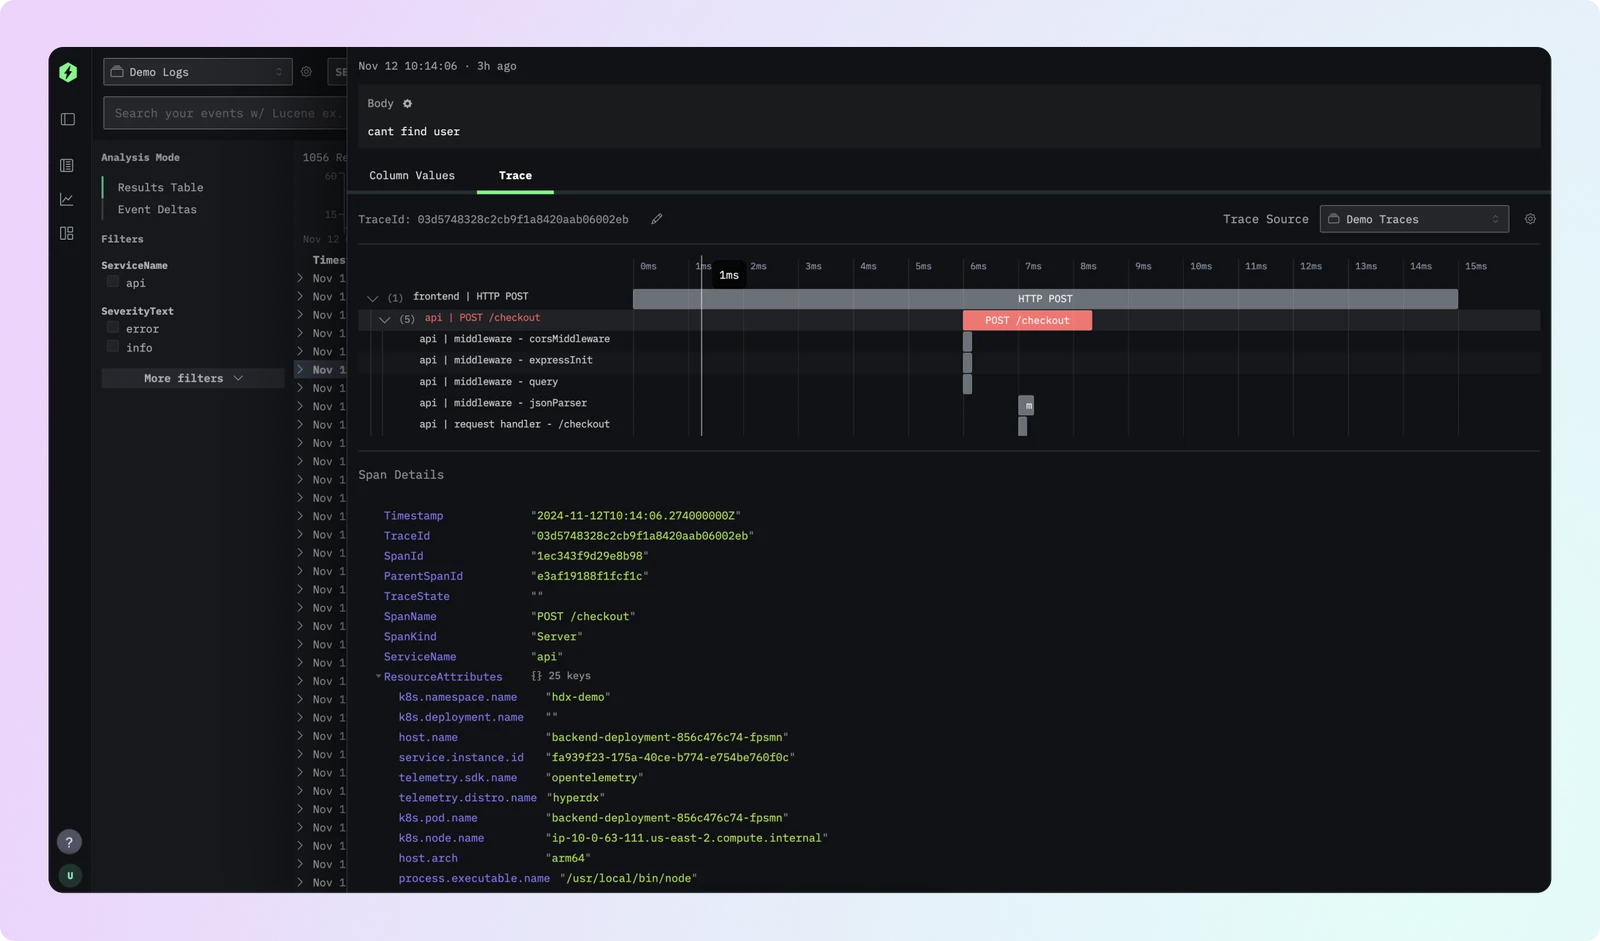
HyperDX is an open-source, self-hosted observability platform that unifies logs, traces, metrics, and session replays into a single interface to help engineers diagnose production issues. The software is deployed as a server application and can be run as a standalone container or as part of the ClickStack suite, which includes MongoDB and an OpenTelemetry Collector.
The platform operates on top of ClickHouse clusters, allowing users to search and visualize telemetry data without requiring a complex query language. It supports various deployment methods, including Docker and ClickHouse Cloud, and is designed to handle high cardinality events. Users instrument their applications using provided SDKs or the OpenTelemetry standard to send data to the HyperDX instance, ensuring that production telemetry is accessible for rapid troubleshooting.
Key features
- Correlation of logs, metrics, session replays, and traces in one place
- Native support for OpenTelemetry across multiple languages and platforms
- Full-text and property search syntax for querying data without SQL
- Live tailing of logs and traces for real-time event monitoring
- Native JSON string querying capabilities
- Alerting system configurable through the user interface
- Schema agnostic integration with existing ClickHouse schemas
- Application performance monitoring from HTTP requests to database queries
HyperDX is built for engineers who need to analyze trends in anomalies using event deltas and monitor system health. It integrates with a wide range of environments, including Kubernetes, and supports a broad array of languages such as JavaScript, Python, Java, Go, Ruby, PHP, .NET, Elixir, and Rust. The architecture relies on ClickHouse for storage and an OpenTelemetry collector for data ingestion, allowing it to function as a specialized visualization and search layer optimized for ClickHouse.
This tool is a unified observability solution for teams seeking to avoid fragmented tooling and high costs associated with proprietary monitoring platforms.
Similar Open Source Software
OpenObserve
Manage logs, metrics, and traces within a single observability platform using SQL and PromQL queries.

Sessy
Track AWS SES deliveries, bounces, opens and clicks through a self-hosted dashboard with real-time search and analytics.

Join our newsletter to get shiny new open source software delivered to your inbox. Unsubscribe anytime.