
Monitor network resources and cloud environments to track availability, notify users of outages, and generate performance data.
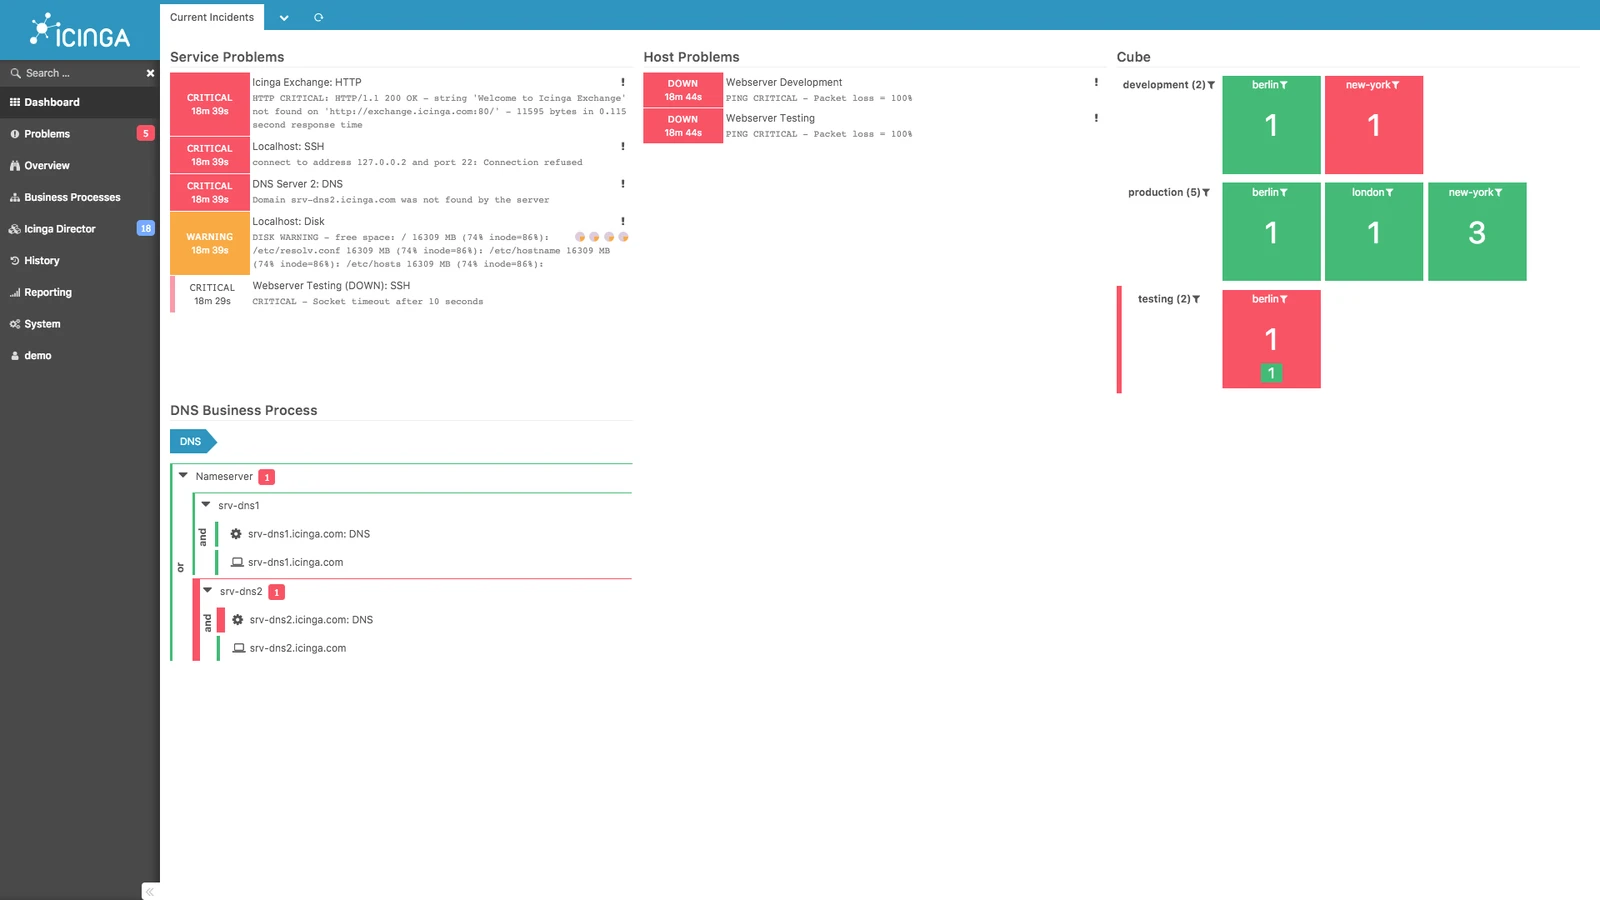
Icinga is an open-source monitoring system. It tracks the availability of network resources, notifies users when outages occur, and collects performance data for reporting purposes. The software is deployed as a server and web application stack to provide visibility into infrastructure health across diverse environments.
Designed for scalability, the system monitors large and complex environments across multiple physical or virtual locations. Users manage the installation through a combination of the Icinga server and the Icinga Web 2 interface. Configuration is handled via the Icinga Director, standard configuration management tools, or plain text using the Icinga Domain Specific Language, allowing for both automated and manual setup processes.
Key features
- Availability checking for network resources
- Automated user notifications for service outages
- Performance data generation for infrastructure reporting
- Distributed monitoring for multi-location environments
- Configuration management via Icinga Director
- Support for plain text configuration using Icinga DSL
- Extensible architecture through various monitoring modules
- Integration with a dedicated web interface via Icinga Web 2
The software is built for system administrators and IT operations teams who require granular control over their monitoring stack. By utilizing a distributed architecture, it can scale to handle thousands of hosts and services across a global network. The system supports a variety of external integrations for metrics and logging, enabling it to fit into broader observability pipelines that include tools like InfluxDB, Graphite, and Graylog. This architecture ensures that monitoring remains consistent even as the number of monitored nodes increases.
Because it is licensed under the GNU General Public License Version 3, the software allows for deep customization and modification of the core monitoring logic. This makes it suitable for organizations with strict compliance requirements or those who need to build highly specific check logic for proprietary hardware and software. The use of a dedicated web interface ensures that performance data is accessible to stakeholders without requiring direct access to the server command line.
Icinga serves as a flexible infrastructure monitoring tool for organizations that prefer a self-hosted, open-source solution.
Similar Open Source Software

NetData
Real-time infrastructure monitoring with per-second metrics and automatic discovery for servers, containers, and cloud environments.

Grafana
An observability platform for querying, visualizing, and alerting on metrics stored across multiple different data sources.



Join our newsletter to get shiny new open source software delivered to your inbox. Unsubscribe anytime.